
.svg)
.svg)
.svg)


.svg)


%20(1).avif)

Alara Akçasız
Every year, we ask professionals a simple question:
What is actually happening behind your slides?
Not what keynote speakers pretend happens, or what SaaS landing pages promise happens.
We ask what really happens at 11:47 PM when your slides are still misaligned, and your chart looks like it was built in 2009.
This year, executives, founders, consultants, and educators answered. They are mostly in tech and very busy.
They told us a clear story:
Presentations are not an occasional task, but they are a recurring performance ritual.
And that ritual has cracks at the peak of the industry.
Presentations Are Not Rare. They’re Recurring and Stressful Events For Professionals.

When we ask how many times they create and deliver presentations. We see that presentations are once a quarter crises for almost all professionals. Even though they don’t present weekly or monthly, they do this at least once every 3 months.
- 83% of respondents create or deliver presentations at least a few times per month.
- 44% do it weekly or more.
When you ask a professional how many times they make presentations, they will probably say “Not much” and act like it’s a once-in-a-year emergency. But that’s not the true story, our research says.
This is a typical paradox we see every year since 2024. This is because people tend to define presentations as keynote speeches, done in a auditorium and they have a big audience. But that’s not true.
A presentation can be:
- One investor update.
- One leadership offsite.
- One sales pitch determines next quarter’s revenue.
- One internal strategy meeting that shapes your promotion.
- A simple demo you show to a prospect
- A campaign idea that you explain to your boss
Even if it's “just once per quarter,” that’s four high-leverage moments per year.
And if your performance in those moments affects:
- Client trust
- Executive perception
- Internal credibility
- Career growth
…then maybe it’s not a minor workflow at all.
The Blank Slide Problem. People Prefer Editing Old Decks Instead of Starting Fresh
Now here’s where it gets interesting. When asked what is a typical workflow you have when you start to make a new presentation, respondents said:
- Edit a previous presentation: 28
- Talk with AI chat tools to plan or structure: 18
- Start from blank: 13
- Use a pre-designed template: 12
- Use AI to create a first draft: 10
Templates are not dominating.
AI-first is not dominating.
The dominant behavior is iteration now. People duplicate old decks, scroll, rewrite, tweak. Because starting from scratch is emotionally expensive.
Staring at a blank slide feels like staring at your fridge at 2 AM. You know something should happen. But nothing inspiring does.
This wasn’t used to be like this. In previous years, we saw a similar but different story. Everyone hated starting from scratch; that didn’t change. However, they used to go and search for templates and merge templates with their previous decks. And the expectation for this year was “ai-first” behaviour.
Yet we still see an attachment to older decks that these people invested in over time. Because they have a “working” prototype, a positive experience from a previous time. So they want to build on top of that. Interestingly, there are not enough tools to help you reiterate from an existing deck, yet.
What this tells us:
People don’t hate presenting. They hate starting and they especially hate starting without structure.
The Real Frustration Is Not Creativity. It’s Production.
When asked, respondents told their top frustrations:
- Formatting issues (elements shifting/aligning): 58.1%
- Making data and charts look good: 52.3%
- Finding high-quality visuals/images: 47.7%
- Keeping brand consistency: 24.4%
- Can’t edit well on mobile: 19.8%
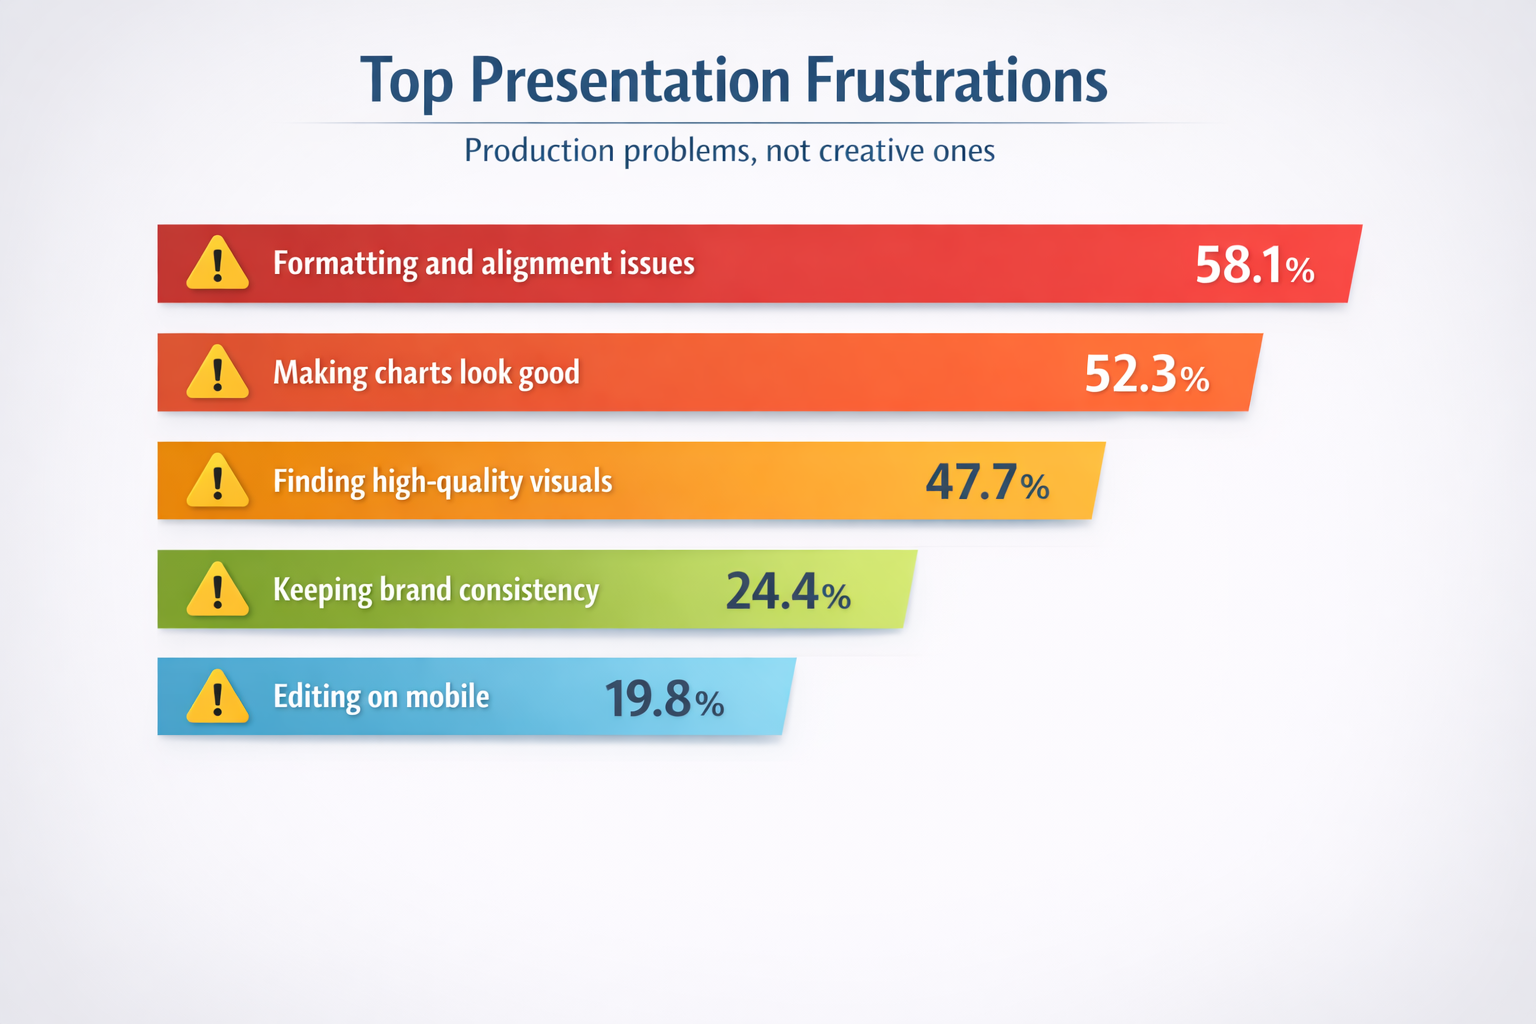
Are you seeing a pattern?
The problem is not: “I don’t know what to say.”
It’s: “My chart looks horrible as a screenshot here.”
Even students, whose audience’s aesthetic expectations are arguably lower, report feeling sloppy when formatting is off.
Formatting isn’t just a visual polish; it’s a psychological security.
When your slide looks misaligned, you feel misaligned.
When your visuals feel cheap, you feel cheap.
We all have aesthetic taste. The frustration begins when we can’t execute what we see in our head.
The market has tried to solve this with templates. But templates are like pre-set outfits.
They help… until you want to wear something slightly different.
Creative freedom without design anxiety is still largely unsolved.
The Confidence and Quality Gap

Now here’s our favorite part of the data.
We asked:
- Visual design confidence (1–5): 3.12 average
- Pride in delivered presentations (1–5): 3.74 average
- Satisfaction with current tool (1–5): 3.38 average
Translation:
People are “moderately confident”. Usually proud. Somewhat satisfied. No one is devastated.
This is the most dangerous market position possible. It’s the “meh” zone.
But here’s what fascinates us:
People are prouder of their final output than they are confident in their design skills. So they believe they survived the process, not mastered it.
And that gap, between internal confidence (3.1) and final pride (3.7), is what we call the Confidence & Quality Gap.
When you produce something decent, you feel proud.
But deep down you still think say “I’m not really a good presenter.”
The fear of presenting, the imposter syndrome, the “What if they ask something I didn’t prepare for?” don’t disappear. They just get quieter, and practice helps.
AI Is Not the Future. It’s the Present. But It’s Not Fully Trusted.
If 2024 was “Should we use AI?”, 2025 was “Okay fine, let’s try it.”. Then 2026 is:
“Yeah, we use it. But we don’t fully trust it.”
Here’s what the data says:
- 75.6% of respondents currently use AI tools in their presentation workflow.
- Lower than 5% says that they don’t use AI for presentations at all.
And usage is not casual. Here’s what they say when asked “how often you use AI while preparing for a presentation”:
- Every time: 20.9%
- Most of the time: 29.1%
- Half the time: 17.4%
- Occasionally: 17.4%
- Rarely: 9.3%
- Do not use: 5.8%
That means a majority of professionals are already AI-assisted creators. Then we asked respondents to rate their trust in AI:
- Creative decisions (design, tone, messaging): 2.87/5
- Strategic decisions (what to show, argument structure): 2.67/5
AI is used frequently. But trust is… cautious.
People are more comfortable letting AI pick a color palette than letting it decide the narrative arc of their board presentation.
We can say that letting AI design your slide is like asking a stylist to pick your outfit, but letting AI decide your argument is like asking someone else to define your career strategy. We still want to hold the steering wheel.
The Trust Gap: Designer vs Strategist

There’s a strong correlation between creative trust and strategic trust.
Meaning, if you trust AI to design your slides, you’re much more likely to trust it to structure your argument.
Trust compounds.
But right now, most professionals are comfortable with AI as a “designer assistant”. Not yet as a “thinking partner.” That’s a very important market signal.
Because it tells us where the next wave of product innovation must go:
From content generator to structured reasoning partner.
At decktopus.com, this is exactly the shift we’ve been watching.
Users don’t just want slides.
They want:
- Argument clarity
- Logical flow
- Narrative pacing
- Brand coherence
- And ideally, feedback before they hit “Present”
The Confidence Paradox
Now here’s a stat that made us sit up straighter.
We found that the more often people use AI, the more satisfied they feel with their tools.
But… Almost no relationship between AI usage and design confidence. This means AI makes the process smoother by increasing satisfaction, but it does not eliminate insecurity.
It’s like using Google Maps. You arrive faster, but that doesn’t mean that you know the city well.
AI is currently a utility. People still feel personally responsible for aesthetic quality.
Interactivity: The Feature Everyone Talks About, No One Uses
We also asked about something that’s been hyped for years: Interactive presentations.
Polling, live engagement, conversational slides.
In theory, everyone loves it.
In practice?
- 34.9% never use interactive elements.
- 34.9% rarely use them.

That’s nearly 70%, barely touching interactivity.
Top blockers:
- The audience doesn’t expect it.
- The tool doesn’t support it well.
- Takes too much time to set up.
- Don’t know how.
- Worried about technical problems.
This is not a resistance but a friction.
When we asked about the future, respondents said:
- They expect presentations to become more interactive and conversational.
- They expect AI-generated content to increase dramatically.
The desire is there, but the workflow is not effortless enough.
The Future: AI-Assisted Creation Becomes Default
When asked how much of presentation creation will be AI-assisted in 2–3 years:
- 46.5% say 76–99%.
- 22.1% say 51–75%.
That means roughly two-thirds expect AI to dominate their workflow. And when asked how creation should feel:
- 44.2% want it to feel like conversing with an assistant.
- 37.2% want to direct and let the tool build.
- Only 5.8% want coding.
- Only 12.8% want “magic automation” without control.
People don’t want magic. They want control + leverage.
They want to speak and direct to the tool, and they don’t want to manually drag.
The 4 Big Shifts Happening in 2026

Based on this year’s data, the presentation landscape is undergoing four major transitions.
1. Presentations Are Operational, Not Occasional
We can no longer treat slide creation like a once-in-a-while task. It’s a recurring professional performance ritual.
If something happens quarterly or more and influences:
- Revenue
- Leadership perception
- Client trust
- Personal confidence
2. The Real Productivity Tax Is Formatting, Not Thinking
We love to believe creativity is the bottleneck, but the data shows that it’s not. The bottleneck is:
- Alignment shifting
- Charts looking amateur
- Visual inconsistency
- Manual layout adjustments
58% cite formatting as their biggest frustration.
Which means the market doesn’t need “more templates.”
It needs:
- Stable structure
- Reliable design logic
- Freedom without layout chaos
At decktopus.com, this is exactly the philosophical shift.
Instead of asking users to become designers, our system absorbs design complexity.
While you focus on ideas, the tool handles visual integrity.
3. AI Is Adopted, But Not Yet Trusted to Think
AI usage is mainstream, but trust in AI is cautious.
Creative trust (2.87/5) slightly exceeds strategic trust (2.67/5).
People are comfortable with:
- “Make this sound better.”
- “Suggest a layout.”
They are hesitant with:
- “Tell me what I should argue.”
- “Decide what matters.”
4. Interactivity Is Desired, But Friction Blocks It
70% rarely or never use interactive elements, but future expectations include:
- More conversational presentations
- Higher AI involvement
- Directed creation
But if interactivity becomes:
- Easy to set up
- Stable
- Predictable
- Low-risk
It will rise naturally.
Conclusion
Presentations are not a side task anymore. They are recurring career moments.
They shape how investors see you, how executives evaluate you, how clients trust you, and how teams follow you.
And yet, most professionals are still operating in the “moderately confident, moderately satisfied” zone, spending hours fixing formatting, cautiously using AI, duplicating old decks, and hoping alignment doesn’t break five minutes before go-time.
AI is here. Adoption is real. But confidence hasn’t caught up.
The next evolution isn’t about generating more slides, it’s about generating more clarity, more structure, and more composure.
Because when everyone has access to decent visuals, the real differentiator becomes:
- How clearly you think
- How logically you structure
- How confidently you deliver
And that’s the shift we’re stepping into: The era of “slides as decoration” is over. The era of “presentations as performance infrastructure” has begun.


.svg)
.svg)
.svg)
.svg)
.svg)
.svg)
.svg)
